There is no single answer for the type of analysis you might require when performing your job as a data analyst. However, there are some types you are more likely to encounter than others. You will likely always perform some level of exploratory analysis, and at other times perform a mix of others, like performance, trend, and link analysis. The type of analysis you perform is based on the data you have on hand and the overall goals of the analysis. In order to know which type of analysis is best suited for your needs, you must first understand what the different types of analysis are and why we use them.
Exploratory Analysis
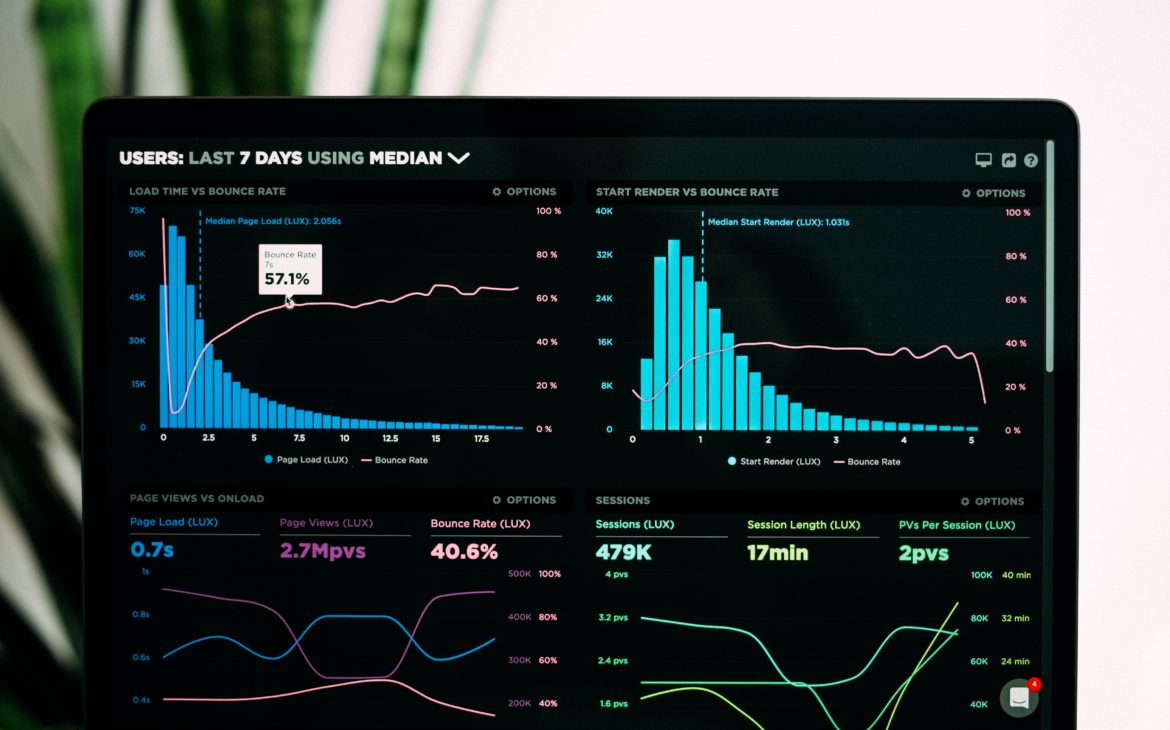
As a data analyst, exploratory analysis is something you should be prepared to perform on literally every data set you encounter. The point of exploratory analysis is to determine the main characteristics of the data set. For example, exploratory analysis can help you determine how much of your data is qualitative (categorical) versus quantitative (countable/measurable). This identification helps inform what type of data cleaning and/or transformation is required. The exploratory analysis provides you with up-front information about the data and is also the easiest type of analysis to visualize.
There are many other key benefits of exploratory analysis.
- Informs what type of statistical testing is appropriate.
- Helps you to investigate potential relationships between data early on.
- Allows you to identify the correlation between data points.
- Informs whether your research questions can be potentially answered with the data.
In order to answer your research question, you will need to know how every student performed, and how each classroom performed in comparison. At the very beginning of your research, you would need to identify whether any students scored very high or very low, as these scores will impact your analysis. Exploratory analysis can provide you with this information.
All data should be explored through exploratory analysis before it is analyzed any further. This is not only a necessary process for the analyst to learn the data, but also a mathematical process that has been in use since the 1970s, when John Tukey encouraged statisticians to use the method to help determine better methods of data collection and discover potential research questions. Tukey recognized that the process helped researchers formulate hypotheses and ultimately led to a better understanding of how to deal with missing data and transformations needed for the variables being studied.
Performance Analysis
Performance analysis is an analysis that is done to measure the performance of a particular product, outcome, or scenario against a defined objective. Performance analysis uses qualitative and quantitative data. Performance analysis data can also be considered non-parametric, meaning that it doesn’t follow the normal distribution curve and thus is not able to be analyzed by all types of testing
Performance analysis is frequently used to test how a particular software program performs to inform optimization of the software. In business, performance analysis is used in combination with metrics like key performance indicators (KPIs). KPIs are measurements/goals that are established to help identify whether a business is achieving its objectives. KPIs can show the overall health of products, work processes, or even sales goals for new salespeople
If we were to conduct a performance analysis on our student scores, we might start by setting a KPI, such as an expectation that students achieve at least three points higher than the average when they have had the extra study time. Then we would look at their actual scores and measure how many are over the three-point average.
KPIs vary because organizations and their goals vary. Understanding how to develop them for the use of these measures in your analysis means that you understand the business, your understand their goals, and you have a good understanding of the data. The overall goal is to determine if the data for that scenario is meeting the defined targets.
Gap Analysis
Gap analysis is the study of a present state, desired state, and the gaps between the two. After identifying these gaps, you can then develop a project (or projects) that help you get to the desired state. When you define how you will accomplish the desired state through the development of a project, you are creating a scope, which includes measurable tasks that are needed to meet the desired end state.
For example, suppose a company has a goal to achieve $100,000 in total revenue for a product. The company must determine the present or current state and then compare it to the goal to identify the gap between those values. The product is a bike that has brought in $75,000 since its debut one year ago. The difference between the current state, $75,000, and the desired state, $100,000, is a gap of $25,000. To earn the extra $25,000, the company decides to redesign the bike pedals and give the bike a new color scheme: this is the scope.
Gap analysis is also commonly used for project management efforts on software development projects. Suppose a company wants to design a new piece of software to replace the paperwork that is currently completed during deliveries. The current state is that the staff delivery team writes out a paper delivery receipt and requires customers to sign the receipt upon delivery of their order.
The desired state is that the delivery staff will use a tablet and request digital signatures. The software development team will study the current state and their knowledge of the desired state, and focus on the gaps to deliver the proper estimate and scope. In the world of software development, or really any development project, scope creep can occur when the scope changes from the original plan and incurs adjustments. These adjustments can cause issues in meeting the various projects, causing a gap in reaching the desired state on time and within budget
Trend Analysis
Trend analysis is defined as measuring a trend in historical data to predict a future outcome. You will typically find trend analysis is used in all industries to determine how something is performing over time or predicting issues with a subject. A subject is a process, person, or product.
-
We can use trend analysis for product or market research, strategic initiatives, future outcomes, and financial trends.
-
Geographic trends are based on geographic locations.
-
Short-term, or temporal, trends occur for a period of time, but not in the long term. For example, if it was predicted that there was going to be a shortage of medical supplies, like gloves and face masks, we might see an increase in purchases of those products for a short period of time.
- Time-related trends occur over a specified period of time. For example, an
increase in toy purchases in the months leading up to Christmas is a time-related
trend.
Trend analysis is also commonly used to forecast future values. If you manage data for an investment firm, you will certainly need to perform trend analysis for a specified period of time for businesses in the portfolio. If you see that a company is trending up or down, that information can inform the investment organization on what they might provide to the company (whether help to recover from a downtrend or support to amplify an upward trend).
Link Analysis
Link analysis is used to determine how a single data point links to other data points, focusing on the relationships and connections in a database. When you determine how data is linked from a primary key to a foreign key, you are performing a type of link analysis in the database.
Link analysis is often used in advertising, particularly for social media networks. For example, suppose you have a relationship with a social media group, and members of that group start to purchase an item from a particular online retailer. Your association with the group of purchasers indicates to the retailer that you may also be interested in their products. The end result is that you could see advertising in your social feeds to purchase similar products from the retailer.
When a network of items exists, link analysis can occur. Consider six degrees of separation, which posits that all people are six or fewer acquaintances away from each other. This idea that you know someone who knows someone, who knows someone else, is essentially the concept behind link analysis.
Link analysis has three main components: a network, a node, and a link. The network is a set of nodes and links. The node is a single point (person, account, product). The link itself is the relationship between the different nodes.
Let’s relate this back to our student test scores example. Imagine that the study hours are spent in a software with a social component (network). Each student is a point (node). Suppose that some of our students performed well on the test, yet others in the extra-hours classroom did not. We might want to explore that data further by viewing the connections between the students (links). Did the students leverage the social components of the software to discuss difficult topics with each other? If we found a relationship between student engagement within the network and higher score performance, we would want to explore that relationship further.
Link analysis is all about relationships among the data points and can provide some very interesting insights when a network component exists within the data.