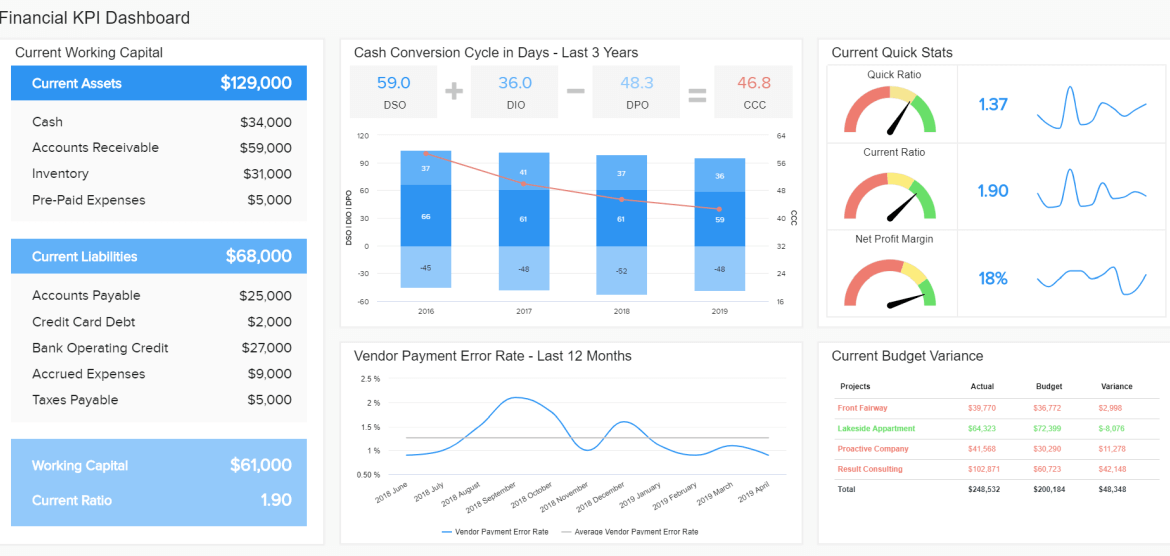
When preparing a report or dashboard, you should understand how the data and
visuals will be viewed or consumed, as this can affect your choice of software. You will also need to know how often the data will be delivered and how frequently people need updates to their reports. Reports that provide crucial data to an organization are commonly run on a recurring schedule.
Determining How Visuals Will Be Viewer
When building a report or dashboard, it’s important to identify how the visuals will be viewed. There are many options for displaying reports and dashboards, including the following methods:
- Viewed via a web interface, like a website, or through an internal intranet site
- Converted to other software, such as presentation software like PowerPoint
or Prezi - Converted to a file format, such as a PDF
- Printed on paper
Determining the appropriate format for viewing reports and dashboards is an important consideration related to business requirements because you will need to not only build the report or dashboard but also export it to the proper format. For example, a visual may need to be included in an annual report or quarterly update that is drafted in Microsoft Word and then exported to a PDF.
If your report or dashboard is to be made available to a web interface, either the corporate intranet or the organization’s public-facing website, it is important to gather the additional requirements needed. For example, you should know who is responsible for making the report or dashboard available on the company’s website and what specifically they need from you, as the data analyst, to complete the task. It may require you to use different software or gain additional permissions.
Most dashboard and reporting tools, such as Power BI, Crystal Reports, and others, can print and/or exported to various formats. For example, when you publish a dashboard in Power BI, it immediately enables you to export it to PowerPoint or PDF format. You should perform a test run of these exports as you refine your dashboard or report to ensure that the visuals translate as expected and are in a helpful format for people reviewing the information.
Power BI in our example allows you to publish to a web interface called My Workspace, and even to others if you have permissions. This allows you to have both a web version of your dashboard and also the available export commands to PowerPoint and PDF.
Determining How Data Will Be Delivered
In a business setting, data is delivered in a number of ways.
- A report, dashboard, or visual is presented in a meeting.
- Information is delivered as a part of a data section on the company website.
- Data is shared in the “report sharing” option of software applications like Power BI or Tableau, which have different environments companies can leverage to share reports across an organization.
- Data can be printed as a paper report and given at a monthly meeting so that consumers like managers, C-level executives, or technical experts can review and mark up information for their needs.
- Data can be subscribed to through the subscription options made available in the software.
The available options for delivering data to your audience depending on the tools and software used when developing your reports and dashboards. Many popular visualization tools allow you to build interactive reports through web-based environments. With these tools, consumers will often subscribe to the reports that they want, and can receive updates based on the times they define. As an example, Salesforce, a popular CRM tool, has its own internal report builder and dashboard options. These features allow for interactive experiences directly inside the software environment. You can easily subscribe to any report that is available to you when you have access to the Salesforce Reports.
Some reports should be delivered on a set schedule (e.g., daily or weekly) as defined by business requirements. For example, a weekly report might be delivered as an Excel or PDF file via email. This type of delivery is a form of static information that people can access according to their schedule. Most enterprise report and dashboard software programs offer some form of scheduled delivery service.
The consideration of whether your data is a continuous/live feed or static data might drive some of your decisions regarding how that data will be delivered to users in your organization. If the data is only updated once a week by a data analyst who simply needs to refresh it, then the overhead of creating a subscription service or interactive dashboard experience might be a waste. However, if the data is live, active, and always up-to-date, then delivering it routinely or through a dashboard might be more effective for the audience than waiting each week to receive an update.
Frequency of Reporting
A key part of developing business requirements for data and reporting is determining how often reports should be updated and how often they should be sent. For example, some businesses send month-end reporting two days after the end of the month to ensure that all data for that month is represented. If you are developing a reporting schedule, be sure to consider the desired timing. For instance, if you want to send out reports as soon as new data is loaded, then write a reporting schedule according to that timing.
Even if it’s difficult to control the timing of when data is updated, it is important for the audience to understand that their data is up-to-date as of a certain time, so that there is no misunderstanding about what data is contained within the reports. As we will cover in a later lesson, you can use the system functions to provide the print date and refresh date of your report or visualization: these would be considered key elements. To ensure that everyone in the distribution list knows what to expect, the analyst should document requirements that explain the frequency of reporting and also how often the data is updated.
Recurring Reports
Just like how many work teams have regular meetings that occur weekly, monthly, or even annually, reports can also be created on a schedule. A report that is set to repeatedly run on certain dates or at specific times is a recurring report. This schedule will include the following:
- The report to be sent
- The output of the report
- Who will receive the report
Reports that provide crucial information to the organization are likely to be run on a recurring basis. Recurring reports are delivered in different ways based on organizational policy and audience preferences. If you are reporting to key executives, for example, you may deliver the report in a print or PDF format (the process for which can also be recurring and sometimes automated).
You may find in the company policy that there are set procedures for exactly where reports can and cannot be stored. As organizations strive for efficiency, they may publish reports on web-based platforms and offer scheduled refreshes so that consumers can have updated data regularly. They may leverage shared drives, in platforms like SharePoint, so that users can access the information from multiple devices whenever it is needed. Along with the institution of these platforms comes IT and security policies intended to protect the information while still allowing the users to securely access data when needed.


