These days, many organizations spread beyond typical borders, crossing over into many different geographic areas. Even smaller companies are likely to have data from different geographical areas, particularly when it comes to surveys and polls. When working with data that has geographic fields, you may find there is a desire to map the data, to show how it appears across the country or even the world. In order to do this, you first will need to confirm that your geographic fields are recognized by the visualization tool.
Preparing Geo Fields for Mapping
Any tool that provides mapping, like Power BI or even Tableau, will also have built-in mapping visuals. There are also software programs specifically designed for mapping, like ArcGIS, which is dedicated to mapping data and offers comprehensive mapping components.
These visuals do have an expectation that your data is recognized as a geographic field. If the program you are using does not automatically detect your data as a geographic field, you can easily convert it. It is also important to ensure that geographic data is complete before you start the mapping process. For example, someone in a survey may have filled in their address but forgotten the zip code. It could also be that you have only partial geographic data—you might have city and state data, but lack county data. You may also find that the software expects very specific data, like latitudinal and longitudinal coordinates. We wouldn’t ask a survey taker to provide this data, but we will use data sets to merge the data we have with this required data.
Geographic Maps
There are two styles of maps you will commonly use to display geographic data: the dot map, which uses markers to note specific spots on the map, and the filled map, which fills in the borders of a location. You may also see layered maps, which blend the two types of maps together.
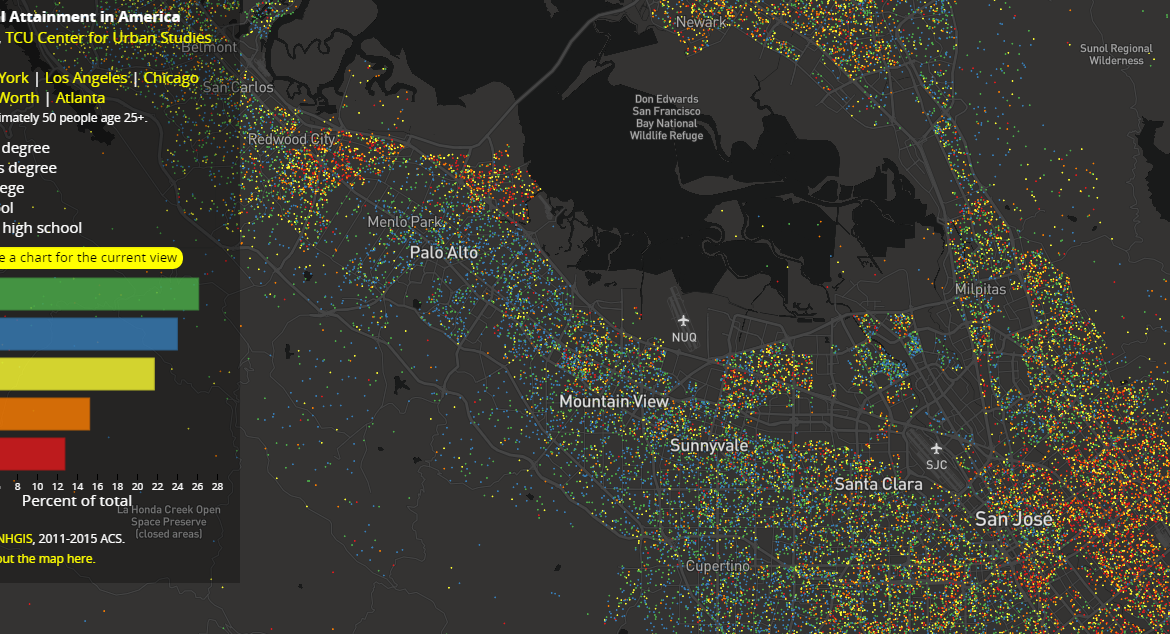
Dot Maps
Dot maps are typically used when we want to pinpoint a location, like a postal code area, or highlight an amount of data occurring within a particular point, such as within a particular state.
Filled Maps
Filled maps fill the border of a geographic location.
Layered Maps
When you want to visualize multiple data points, a layered map may be your best choice. Layered maps contain different layers for various data points within the data set, using both dot and filled approaches, and can give you the most comprehensive experience.
Conclusion
From this article, we got to know which software is dedicated to mapping and offers comprehensive mapping components. Then how we can transform data which we are likely to need before visualizing geographic fields and many more things.
Read More: How to do Data Profiling?