Visuals can be extremely impactful to learning and processing. Consider that when children are first learning how to read, they are often presented with a picture alongside a letter. For example, to introduce the short vowel sound for the letter “A” a child may be shown a picture of an apple. This helps children remember that “A” sounds like “ah” as in “apple.” This same line of thinking works for data as well. When lines of data are represented by a visual, we can easily see and digest the information without having to work with all the records. Basic visuals can help support the understanding of thousands or even millions of records of data and are commonly used to effectively represent information in a meeting, report, or dashboard. So today we are going to see how data analysts visualize their data and help in getting a better insight of the data.
Pie Charts and Treemaps
There are two types of visualization that are commonly used to display information in a way that shows the proportion of one (or more) data points: pie charts and treemaps.
Pie Charts
The most basic of all visuals is the pie chart, a circle broken into slices to represent percentages of information. The pie chart is easy to understand and thus is commonly used. Although there are other visuals that can show percentages, it is important to remember that a pie chart gives us a proportional visual for a whole group of records.
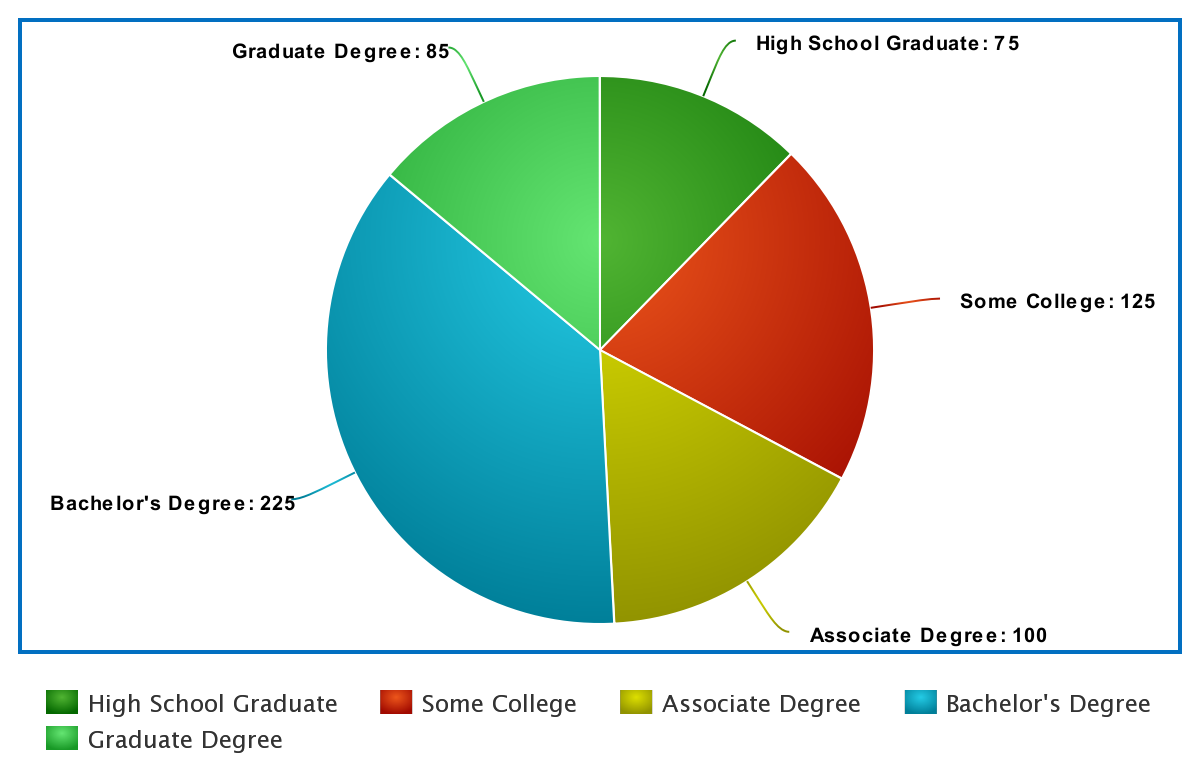
Let’s see a pie chart in action. Suppose we have a data set from a survey where we asked respondents to specify their highest level of education. We have 610 responses, and the answer options were high school graduate, some college, associate degree, bachelor’s degree, and graduate degree. First, let’s aggregate this data into a table to count the total responses for each answer option.
| Education Type | Count |
| High School Graduate | 75 |
| Some College | 125 |
| Associate Degree | 100 |
| Bachelor’s Degree | 225 |
| Graduate Degree |
85 |
While the table is certainly more effective than reading all the records, it still requires the viewer to assess each value individually and then determine which education level received the most responses. But when we visualize this data in a pie chart, a simple glance easily shows us which answer has the most responses— and the highest proportion of the pie.
Treemaps
A treemap is a rectangle that shows the proportion of values using smaller rectangles within the larger one. Treemaps also can display a hierarchy when visualizing two data points, with a breakdown of both data points.
Column and Bar Charts
When you want to display the distribution of data, you’ll want to choose a column chart or bar chart. These types of visualization show the total values of categories of data. Both bar charts and column charts are set on an x-axis (horizontal axis) and y-axis (vertical axis). The major difference between the two is the direction of the display: a bar chart reads horizontally while a column chart reads vertically. Either type of chart can show the distribution of basic information, so the choice of which to use depends on your preference.
Bar Charts
In a simple bar chart, the y-axis (vertical axis) lists the categories of information and the x-axis (horizontal axis) is labeled with a set of (discrete number) values that are a set distance from each other.
Column Charts
A column chart displays the same information as a bar chart but swaps the axes, meaning the x-axis lists the categories of information and the y-axis is labeled with the numerical values. Using the survey example again, we list the answer options on the x-axis and draw rectangles up to the appropriate value for each.
They are also often used to show revenues, sales, or other information consisting of dollar amounts, as this type of chart allows us to isolate and quickly compare each time period.
Column charts are generally easy to read, but some people might prefer line graphs for this type of information. Thus, you will need to work with the consumer or decision maker when determing the appropriate visualization type.
Line Graphs
A line graph, or run chart, consists of either a single horizontal line or a group of multiple lines that represent different data points at different times. This is typically the visual of choice when we want to look at time series data, or data over intervals of time, as the connected line makes it easier to see exactly how that data changes over time.
Adding Markers
To further emphasize certain points in a line graph, we can add a marker, which is often a dot or square placed on the line that makes it a little easier to distinguish the point. In a dashboard design, we can control what information shows up when the mouse hovers over the dot, allowing us to provide even more insight into the visual. In most popular visualization tools, the marker can also be used to display more information (in a pop-up) about the data point.
Tools like Power BI and Tableau allow you to build more information into your pop-up display than Excel, like our example here that just shows the series name and the value.